Snowflake images#
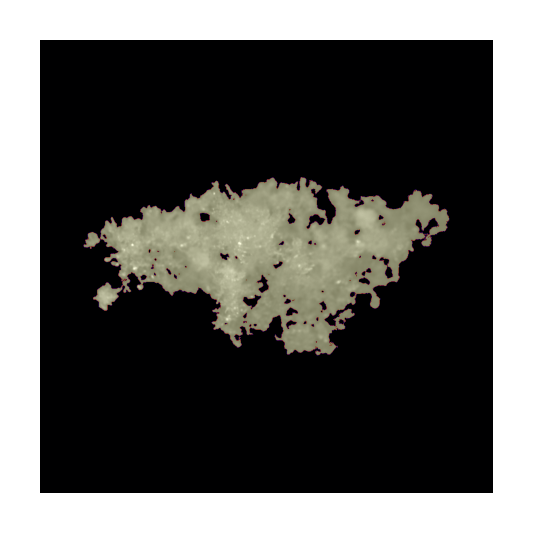
We can now display a few actual images of the snowflakes in the database, to show how they appear.
[ ]:
# Imports
import math

import matplotlib as mpl
import matplotlib.pyplot as plt
import numpy as np
from matplotlib import patches

mpl.rcParams.update(
    {"font.size": 12, "legend.frameon": False, "font.family": "sans-serif", "mathtext.default": "regular"},
)
mpl.rcParams["figure.dpi"] = 400

# Scikit image
from skimage import measure

# MASC DB
from mascdb.api import MASC_DB
from mascdb.utils_img import _hist_equalization

dir_path = "/data/MASC_DB"  # It must contains the 4 parquet files and the Zarr storage

# Create MASC_DB instance
mascdb = MASC_DB(dir_path=dir_path)
Image descriptors visualization#
Let’s now compute and/or visualize some image descriptors using skimage on raw gray-scale images in combination with precooked attributes available in the tabular database.
We are now just scraping the surface. There are many ways to display or manipulate the images. There is however a functionality that is worth to mention, which is mascdb.api.MASC_DB.compute_2d_image_descriptors. The interested users should have a look at it as it allows to compute new descriptors and to include them in the database.
[ ]:
# Select only high quality images in CAM1 (as example)
idx = mascdb.cam1["quality_xhi"] > 9.5
mascdb = mascdb.isel(idx)

# Arrange the database with large Dmax first and choose one image
mascdb = mascdb.arrange("cam1.Dmax", decreasing=True)
img = mascdb.da.isel(cam_id=1, flake_id=1).values
/home/grazioli/anaconda3/envs/mascdb/lib/python3.8/site-packages/xarray/core/indexing.py:1226: PerformanceWarning: Slicing with an out-of-order index is generating 83 times more chunks
  return self.array[key]
[ ]:
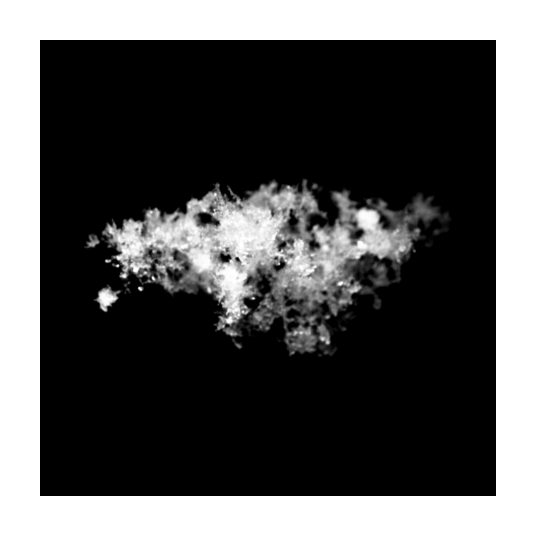
# Get image
plt.figure(figsize=(1.5, 1.5), tight_layout=True)
plt.imshow(_hist_equalization(img), cmap="gray")
plt.axis("off")
(-0.5, 1023.5, 1023.5, -0.5)
[ ]:
# Retrieve some standard image properties
# Obtain a binary image
binary_mask = img > 0
# Background is label 0
labels = measure.label(binary_mask)
# Remove spurious stuffs
labels[labels != 1] = 0
# compute properties of regions
region_props = measure.regionprops(labels)
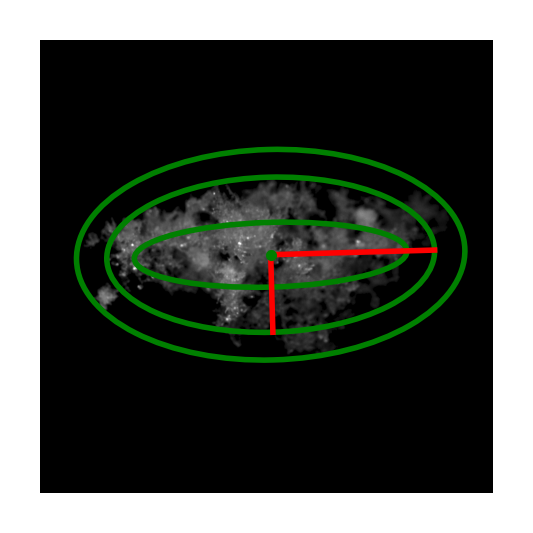
# Plot minor and major axis of the ellipse, the centroid
fig, ax = plt.subplots(figsize=(1.5, 1.5))
ax.imshow(img, cmap=plt.cm.gray)
# Flake id and resolution
flake_id = 1 # as in previous block
res = mascdb.cam1.iloc[flake_id].pix_size
# Plot fitted, internal and external ellipse
for props in region_props:
y0, x0 = props.centroid
orientation = props.orientation
x1 = x0 + math.cos(orientation) * 0.5 * props.minor_axis_length
y1 = y0 - math.sin(orientation) * 0.5 * props.minor_axis_length
x2 = x0 - math.sin(orientation) * 0.5 * props.major_axis_length
y2 = y0 - math.cos(orientation) * 0.5 * props.major_axis_length
# Plot orientation
ax.plot((x0, x1), (y0, y1), "-r", linewidth=1)
ax.plot((x0, x2), (y0, y2), "-r", linewidth=1)
ax.plot(x0, y0, ".g", markersize=2)
# Plot ellipse(s)
e1 = patches.Ellipse(
(x0, y0),
props.minor_axis_length,
props.major_axis_length,
linewidth=1,
fill=False,
angle=-1 * np.rad2deg(props.orientation),
color="g",
)
ax.add_patch(e1)
e1 = patches.Ellipse(
(x0, y0),
2 * mascdb.cam1.iloc[flake_id].ell_out_B / res,
2 * mascdb.cam1.iloc[flake_id].ell_out_A / res,
linewidth=1,
fill=False,
angle=-1 * np.rad2deg(props.orientation),
color="g",
)
ax.add_patch(e1)
e1 = patches.Ellipse(
(x0, y0),
2 * mascdb.cam1.iloc[flake_id].ell_in_B / res,
2 * mascdb.cam1.iloc[flake_id].ell_in_A / res,
linewidth=1,
fill=False,
angle=-1 * np.rad2deg(props.orientation),
color="g",
)
ax.add_patch(e1)
plt.axis("off")
plt.show()
[ ]:
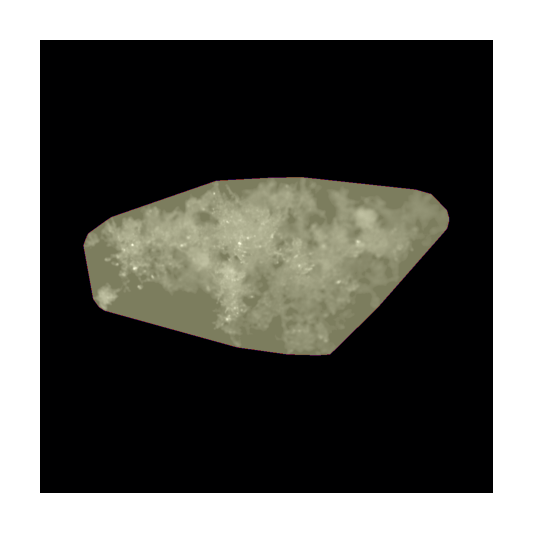
# Overlay the convex hull mask
fig, ax = plt.subplots(figsize=(1.5, 1.5))
ax.imshow(img, cmap=plt.cm.gray)

for props in region_props:

    # Overlay an image
    img_overlay = labels * 0

    img_overlay[props.bbox[0] : props.bbox[2], props.bbox[1] : props.bbox[3]] = props.convex_image * 255
    ax.imshow(img_overlay, cmap="magma", alpha=0.5)

plt.axis("off")
plt.show()
[ ]:
# Overlay a binary mask with internal holes
fig, ax = plt.subplots(figsize=(1.5, 1.5))
ax.imshow(img, cmap=plt.cm.gray)

for props in region_props:

    # Overlay an image
    img_overlay = labels * 0

    img_overlay[props.bbox[0] : props.bbox[2], props.bbox[1] : props.bbox[3]] = props.image * 255
    ax.imshow(img_overlay, cmap="magma", alpha=0.5)

plt.axis("off")
plt.show()